Class 10 NCERT Solutions- Chapter 14 Statistics – Exercise 14.4
Last Updated :
03 Feb, 2023
Question 1. The following distribution gives the daily income of 50 workers if a factory. Convert the distribution above to a less than type cumulative frequency distribution and draw its ogive.
| Daily income in Rupees | 100-120 | 120-140 | 140-160 | 160-180 | 180-200 |
| Number of workers | 12 | 14 | 8 | 6 | 10 |
Solution:
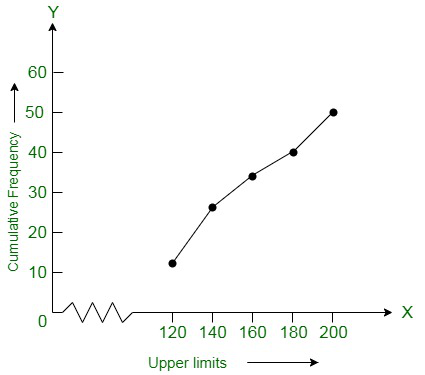
According to the question, we convert the given distribution to a less than type cumulative frequency distribution,
| Daily income | Frequency | Cumulative Frequency |
| Less than 120 | 12 | 12 |
| Less than 140 | 14 | 26 |
| Less than 160 | 8 | 34 |
| Less than 180 | 6 | 40 |
| Less than 200 | 10 | 50 |
Now according to the table we plot the points that are corresponding to the ordered pairs (120, 12), (140, 26), (160, 34), (180, 40), and (200, 50) on a graph paper. Here x-axis represents the upper limit and y-axis represent the frequency. The curve obtained from the graph is known as less than type ogive curve.
Question 2. During the medical check-up of 35 students of a class, their weights were recorded as follows:
| Weight in kg | Number of students |
| Less than 38 | 0 |
| Less than 40 | 3 |
| Less than 42 | 5 |
| Less than 44 | 9 |
| Less than 46 | 14 |
| Less than 48 | 28 |
| Less than 50 | 32 |
| Less than 52 | 35 |
Draw a less than type ogive for the given data. Hence obtain the median weight from the graph and verify the result by using the formula.
Solution:
According to the given table, we get the points (38, 0), (40, 3), (42, 5), (44, 9), (46, 14), (48, 28), (50, 32) and (52, 35). Now using these points we draw an ogive, where the x-axis represents the upper limit and y-axis represents the frequency. The curve obtained is known as less than type ogive.
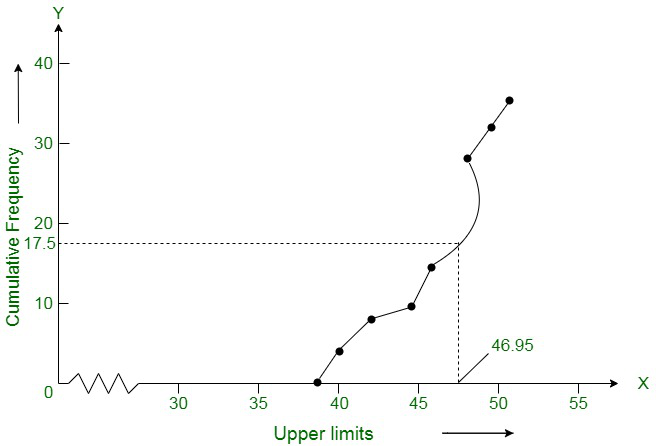
Now, locate the point 17.5 on the y-axis and draw a line parallel to the x-axis cutting the curve at a point. From this point, now we draw a perpendicular line to the x-axis and the intersection point which is perpendicular to x-axis is the median of the given data. After, locating point now we create a table to find the mode:
| Class interval | Number of students(Frequency) | Cumulative Frequency |
| Less than 38 | 0 | 0 |
| Less than 40 | 3 – 0 = 3 | 3 |
| Less than 42 | 5 – 3 = 2 | 8 |
| Less than 44 | 9 – 5 = 4 | 9 |
| Less than 46 | 14 – 9 = 5 | 14 |
| Less than 48 | 28 – 14 = 14 | 28 |
| Less than 50 | 32 – 28 = 4 | 32 |
| Less than 52 | 35 – 22 = 3 | 35 |
The class 46 – 48 has the maximum frequency, hence, this is the modal class
l = 46, h = 2, f1 = 14, f0 = 5 and f2 = 4
Now we find the mode:
Mode = 
On substituting the values in the given formula, we get
= 46 + 0.95 = 46.95
Hence, the mode is verified.
Question 3. The following tables give the production yield per hectare of wheat of 100 farms of a village.
| Production Yield | 50-55 | 55-60 | 60-65 | 65-70 | 70-75 | 75-80 |
| Number of farms | 2 | 8 | 12 | 24 | 38 | 16 |
Change the distribution to a more than type distribution and draw its ogive.
Solution:
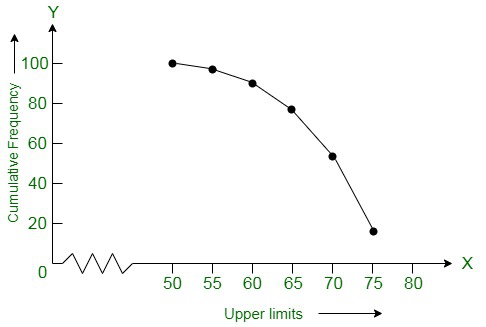
According to the question, we change the distribution to a more than type distribution.
| Production Yield (kg/ha) | Number of farms |
| More than or equal to 50 | 100 |
| More than or equal to 55 | 100 – 2 = 98 |
| More than or equal to 60 | 98 – 8 = 90 |
| More than or equal to 65 | 90 – 12 = 78 |
| More than or equal to 70 | 78 – 24 = 54 |
| More than or equal to 75 | 54 – 38 = 16 |
Now, according to the table we draw the ogive by plotting the points. Here, the a-axis represents the upper limit and y-axis represents the cumulative frequency. And the points are(50, 100), (55, 98), (60, 90), (65, 78), (70, 54) and (75, 16) on this graph paper. The graph obtained is known as more than type ogive curve.
Like Article
Suggest improvement
Share your thoughts in the comments
Please Login to comment...